Mathematical model of me is a project we did in Dr. Drew's class. In this project we had to choose an image that was relevant to us and trace it onto graph paper. After we traced it we had to plot the individual lines and enter the coordinates into the graphing program GeoGebra. After we graphed them in GeoGebra, we adjusted the points and lines and made it just the way we liked it. After we were satisfied with our GeoGebra creation, we printed it and coloured it, or coloured it digitally in GeoGebra or Photoshop. The steps I took to create beautiful work were to choose an image, trace it, plot in geogebra, and then colour it and make it beautiful. At first I chose an image of myself, but that image turned out to be way too hard to plot in GeoGebra. I chose this image instead:

I chose this image because it is one of the most difficult things to type on a keyboard. However, I have mastered typing it. ( ͡° ͜ʖ ͡°)
This image is important to me because it took a long time to learn to type. The main components of GeoGebra are the algebra view, where you plot all of your points and the graphic view, where your creations show up after plotting the points.
Benchmark 1:
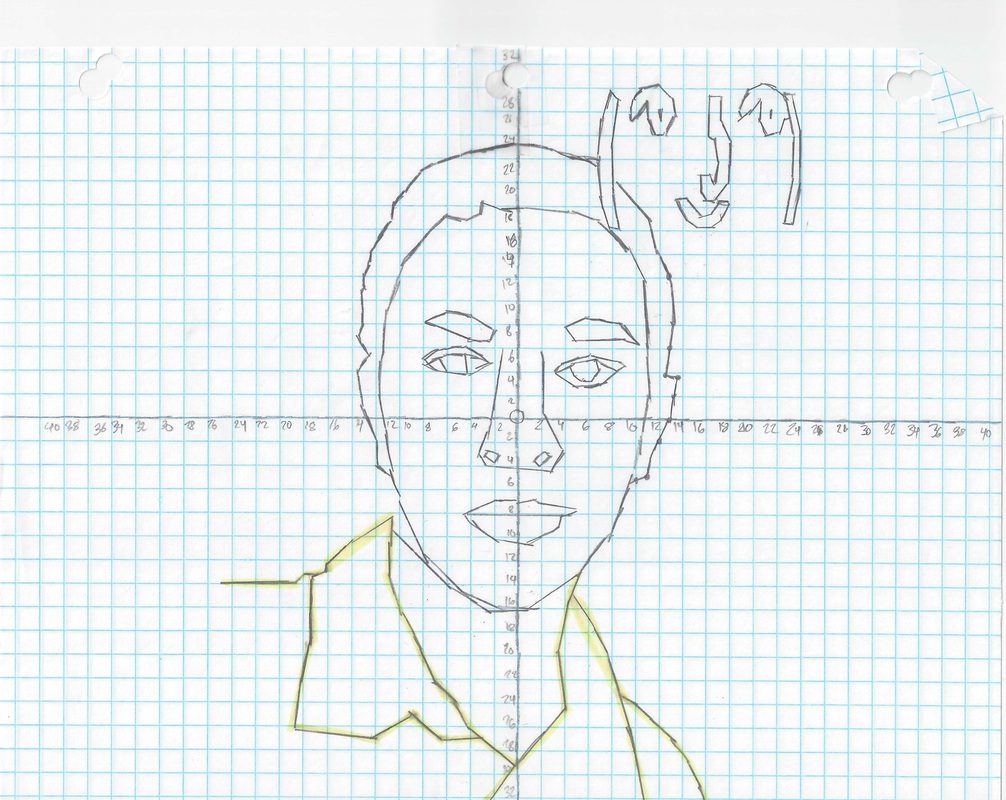
Benchmark 1 was choosing an image, which I chose my head before replacing it with the other image.
Benchmark 2:
Benchmark 2 involved tracing your image onto graph paper, and then plot the points and find the coordinates.
Benchmark 3:
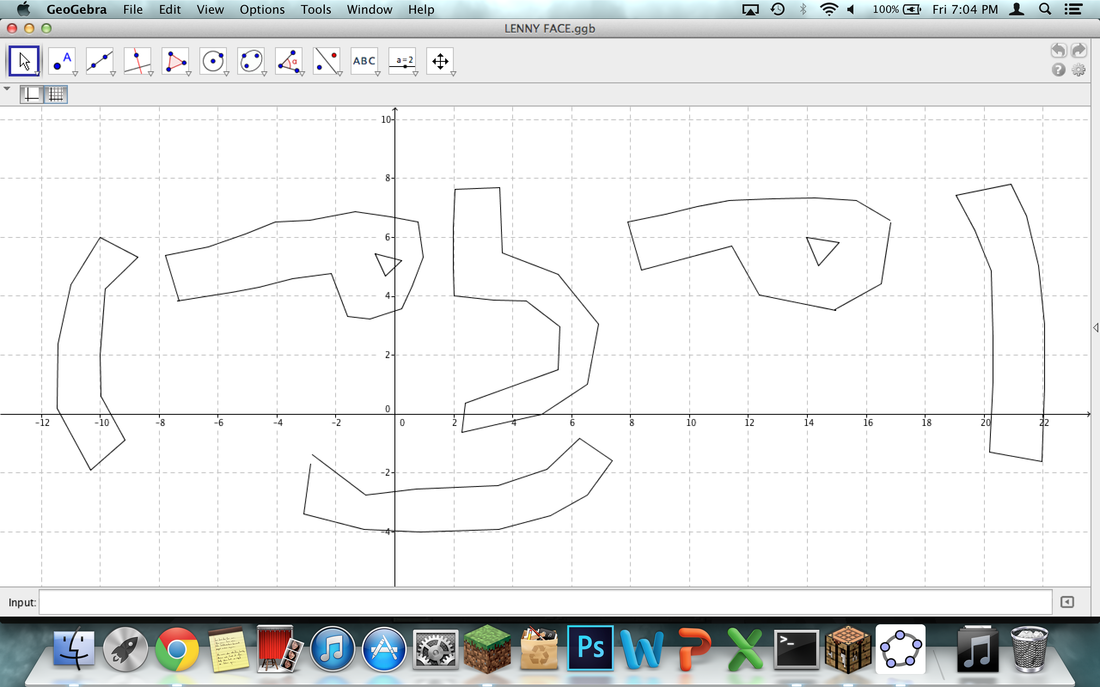
Benchmark 3 involved plotting the points into the program GeoGebra and create polylines to connect the points.
This image is important to me because it took a long time to learn to type. The main components of GeoGebra are the algebra view, where you plot all of your points and the graphic view, where your creations show up after plotting the points.
Benchmark 1:
Benchmark 1 was choosing an image, which I chose my head before replacing it with the other image.
Benchmark 2:
Benchmark 2 involved tracing your image onto graph paper, and then plot the points and find the coordinates.
Benchmark 3:
Benchmark 3 involved plotting the points into the program GeoGebra and create polylines to connect the points.
Benchmark 4:
Benchmark 4 involved exporting the image from GeoGebra and colouring it either digitally or in a bigger art piece.
Benchmark 4 involved exporting the image from GeoGebra and colouring it either digitally or in a bigger art piece.
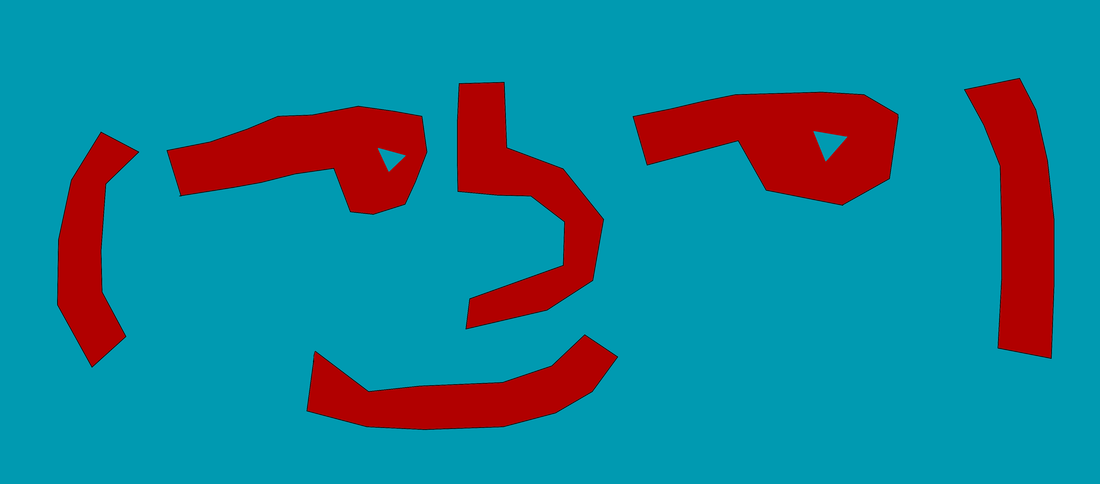
I started on GeoGebra by collecting all of the points and writing them down in a central location. Then I went into GeoGebra and set my aspect ratio to 1:1 so the image would be shown properly. I then began putting in the coordinates. After I put in all the coordinates, I highlighted the ones I wanted to be put into a line. After I did that, I highlighted all of the coordinates and created polylines. After I created the polylines I exported the image into photoshop and coloured it digitally. My Benchmark 4 art piece is shown above.
What is a mathematical model?
A mathematical model is a model of an image or object that you have plotted all points in it, put them into a computer and created a 3d model of the object.
How can complex imagery be modeled mathematically?
Complex images can be modeled with math by flattening out the image and plotting the points.
How can productivity software be used for graphing?
If the program you are using has a graph like GeoGebra or Grapher, it can be used for graphing.
Benchmark #2:
For benchmark #2 I have my old image, I didn't like this image because there were too many lines and points. It would have taken forever to graph.